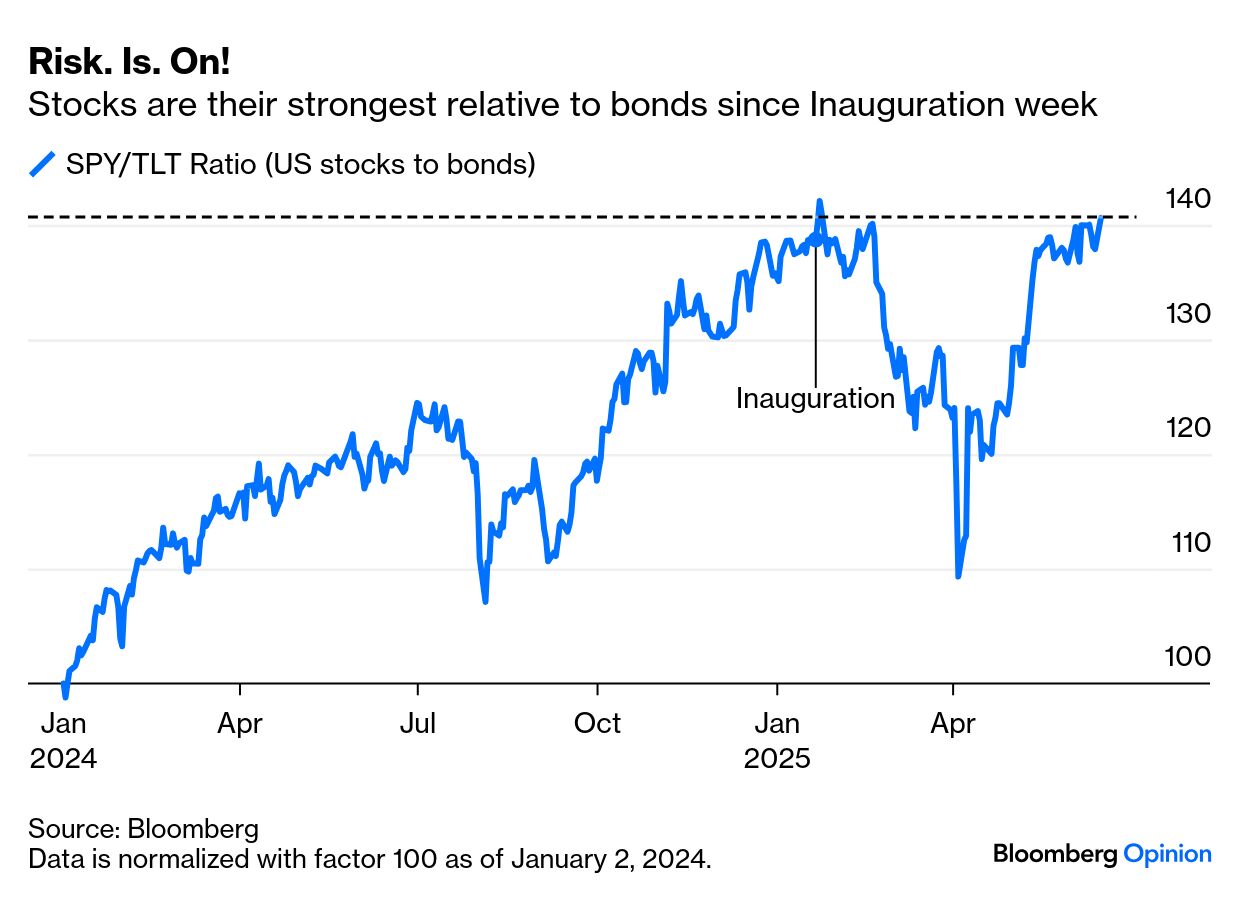
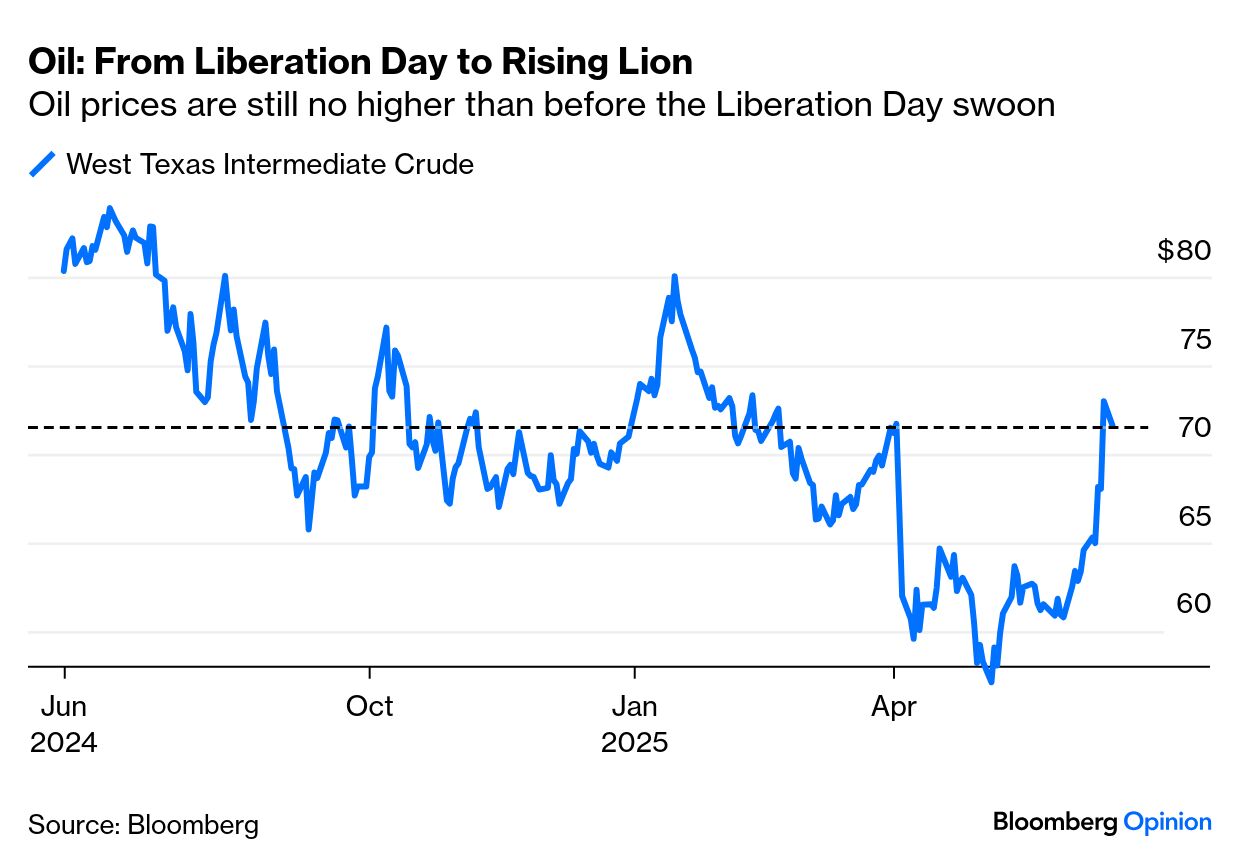
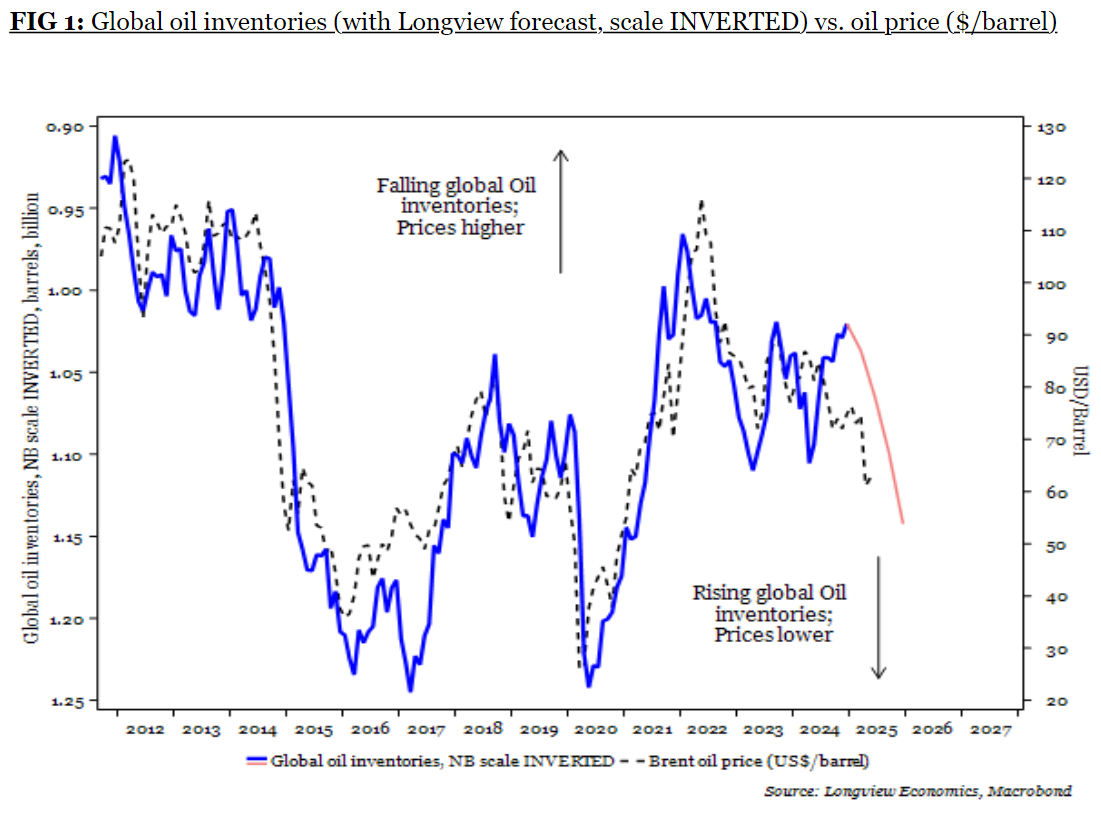
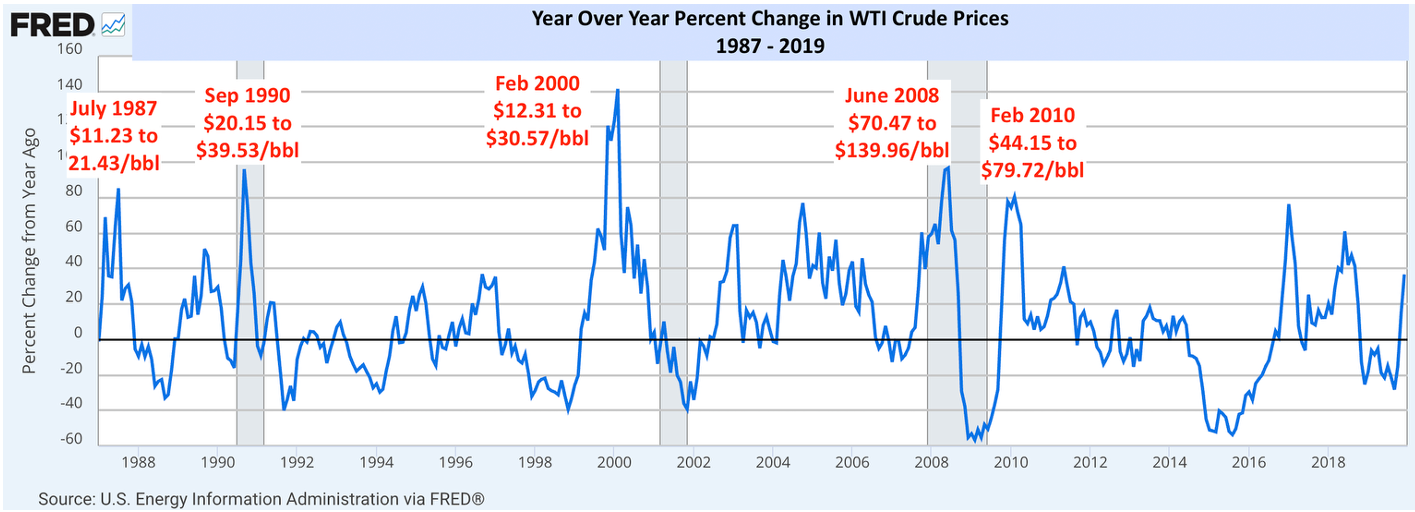
| International markets appear to have convinced themselves that the latest conflagration in the Middle East can be looked through as easily as all the region’s other flare-ups of the last decade. Are they right to do so? Gold prices fell, Treasury yields rose, and equity volatility dropped Monday as Israel and Iran continue to pound each other with bombs and missiles. Most startlingly, stocks rebounded; relative to long bonds, they are their strongest since the day after President Donald Trump’s inaugural: All the normal signs of a “risk-on environment” were in evidence. This despite the fact that an Israeli attack on Iranian nuclear facilities has long been regarded as “the Big One” that could transform the global risk environment for the worse. And yet the oil price fell Monday, and it’s far below its January peak: Iran is now trying to find a way out of the conflict, but Israel has little desire to halt when it is on top. Arguably, there’s something “positive” in the absence of developments that might seriously constrict oil supply— closure of the Strait of Hormuz by Iran, or damage to Iranian oil production by Israel. But with Prime Minister Benjamin Netanyahu pressing on, the danger of such events in the future remains. So can the market calm possibly make sense? Here are the cases for and against: The Case for Calm Middle East conflicts matter to markets and the global economy because they can impact the oil price. On that basis, Israel has chosen a “good” time. Oil inventories are rising, and the OPEC+ countries have been trying to restrict supply. Many will be happy for an excuse not to go through with this. Such dynamics point to downward pressure on oil. This chart from Harry Colvin of Longview Economics in London illustrates what’s going on: Longview points out that the oil market has a way of seeing Israel-Iran conflicts coming, and pricing them. Crude makes a high when the news breaks, and then subsides. This happened during the missile exchanges in April last year. Colvin comments that “a similar playbook may repeat this time,” given that the oil price was up 20% Friday from its lows May 5 – possibly in anticipation of the resumed conflict. Further, history suggests that the oil price needs to double before it can inflict a recession in the west. Evidently that happened in the 1970s. This chart, drawn up with the St. Louis Federal Reserve’s FRED service by Nicholas Colas of DataTrek International, shows that from 1987 to the pandemic, recessions all followed close after a doubling of the oil price: The other two doublings, in 1987 and 2010, came when oil was “normalizing after hitting multi-year lows rather than breaking out to decade-plus highs.” As the recent low was $57.50, that would imply that West Texas Intermediate needs to reach $115 before it forces a recession — and probably top its post-Ukraine invasion peak, when it spent a few days above $120. With WTI at $72, that’s a long way off. Beyond the current specifics, history suggests that the market can deal with big geopolitical shocks just fine. Hitler’s invasion of France and the 1973 Yom Kippur War were big exceptions. Beyond that, Jim Reid of Deutsche Bank AG relays this statistic: Historically, the S&P 500 tends to fall around -6% in the three weeks following a geopolitical shock, only to recover fully over the subsequent three weeks... The bar for a more significant selloff is higher this time, as equity positioning is already quite light — currently -0.33 standard deviations below the mean, or in the 28th percentile.
Deutsche’s researchers list 32 political events since 1939 that led to selloffs. They took a median of 16 trading days to hit bottom, and 17 days thereafter to recover all lost ground. Small wonder that traders look at any geopolitical dip as a chance to buy. There are also some surprises. The S&P 500 had recovered all its losses from the Cuban missile crisis of October 1962, the closest the world has come to nuclear Armageddon, within nine days. Two decades later, it would take 304 days to recover from another Caribbean confrontation, the US invasion of Grenada in October 1983. The variability between apparently similar events is also marked. Recovery from the Six-Day War of 1967 took 40 days; getting over the Yom Kippur War took 1,475 days (thanks largely to the subsequent Arab oil embargo). Tail risks exist. The point is that they are unlikely, but risk managers need to take account of them. |